
Research project
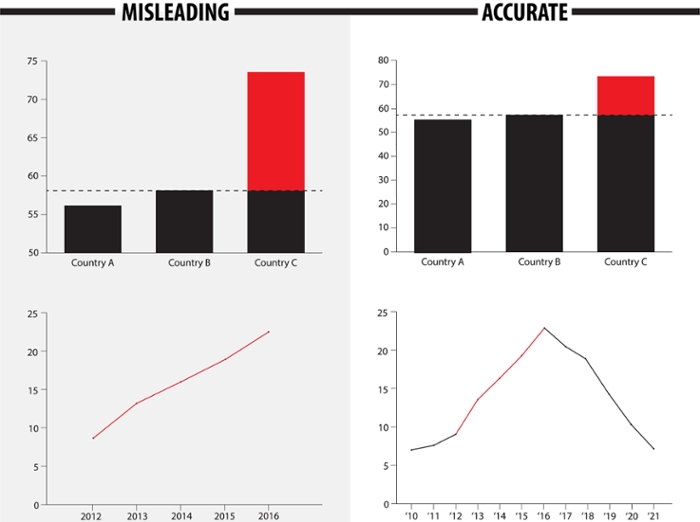
Using factchecks to combat misleading graphs
How can misleading graphs be effectively corrected, specifically for people with low graph literacy?
- Duration
- 2021 - 2023
- Contact
- Ionica Smeets
- Funding
- Leiden University Fund 2020
Project discription
Social media are swamped with different kinds of misleading data. Factchecks can be an effective mean to combat textual and verbal misinformation, but little is known about how this can be done for visual information such as graphs. In this project, researchers from the faculty of Science (Science Communication & Society, Statistical Science) and Humanities (Journalism and New Media) investigate how to counter graphs with stretched axes, hidden data or other tricks that give a biased impression of the underlying data: e.g. with a better graph or a clear explanation. In the project, one study focusses specifically on people that have difficulty interpreting graphs due to low graph literacy. These are the people most susceptible to misleading graphs.
Design
The project involves two studies, each with a randomized experiment. The first experiment involves six hundred people divided into an experimental group and a control group. First, both groups are shown a misleading graph displaying information about a hypothetical context. Next, the experimental group is randomly offered one of various correcting alternatives (e.g. an explanation or a better graph). The control group is offered neutral additional information. After this, both groups will be asked to explain what they have remembered and what is their opinion on the topic.
The second experiment has a similar set-up, and involves six hundred people with low graph literacy. The outcomes of the first experiment are used to determine what correcting alternatives to offer, and how these can be improved even.
Output
This research project results in guidelines for factcheckers, science communicators, and (data) journalists on how to effectively combat misleading graphs. These will be described and discussed in scientific papers, a science communication symposium, and a video.