New ecological maps show a wider range of functional diversity
Together with a large international team of scientists, researchers Peter van Bodegom and Nadia Soudzilovskaia of the Leiden Institute of Environmental Sciences (CML) have created maps of variability in plant trait distribution across the globe. The new maps have been published in Proceedings of the National Academy of Sciences in December 2017.
Mapping plant traits
Earth vegetation models are used to understand, predict and manage the functioning of ecosystems. They show the variation in, for example, forms and structures of plants. Ecologists can classify plants into plant functional types.
Together with their team, professor of Environmental Biology Peter van Bodegom and assistant professor Nadia Soudzilovskaia of the Leiden Institute of Environmental Sciences (CML) have made detailed maps of plant traits in the world, enhancing the accuracy of earth vegetation models leading to new ecological insights.
A new approach
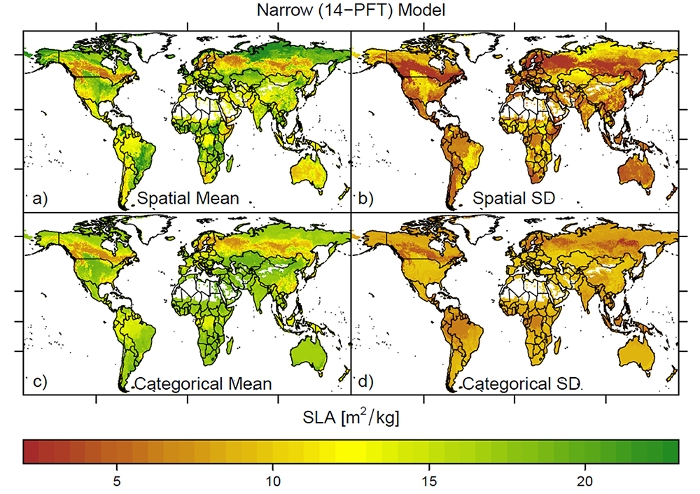
To create these more precise maps, the research team focused on a set of plant traits coupled to photosynthesis and foliar respiration instead of plant functions. One example is the specific leaf area, the ratio of leaf area to dry mass.
For their research the team used the world’s largest plant trait database, containing data collected in different regions, such as North America, Europe, Australia and Brazil. With these global data added, the maps capture a wider range of functional diversity. These are the elements of biodiversity that influence how ecosystems function. The maps also show substantial local variation and a more accurate representation of the land surface.
Predicting ecosystem response
Soudzilovskaia focuses her research on the impact of land use and global environmental change on biodiversity. Global warming has a large effect on most ecosystems. With the new maps, the response of ecosystems to a changing environment can be better understood and predicted.
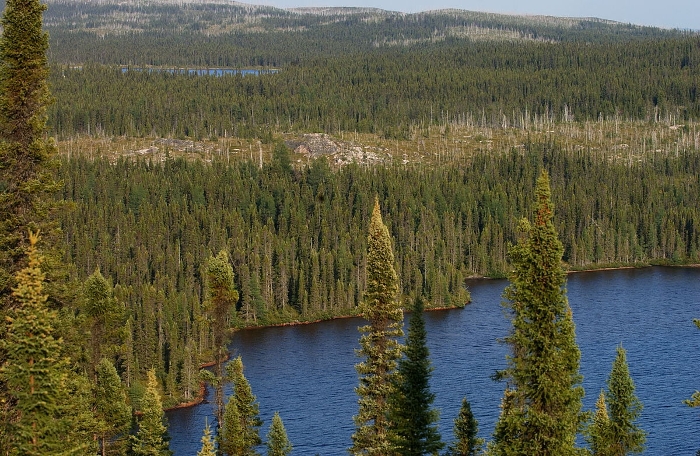
The maps also suggest new ecological insights. For example, Soudzilovskaia says: ‘The niche space appears to be smaller than expected in boreal regions, for example, the taiga in Canada. The fit of different organisms living under specific environmental conditions is smaller than expected in this area. The low variation across different traits within these forests implies that there is strong filtering of the air.'