What can you do to help solve the nitrogen crisis?
This semester we again organize the elective Nitrogen and Sustainability for 36 master students mainly from Industrial Ecology and Governance of Sustainability. The course helps the students to understand the complexity of the Dutch nitrogen crisis and the role different stakeholders play.
The crisis has already been going on for 3,5 years in the Netherlands. To help you remember the situation: The ruling of the European Court in 2018 requires nitrogen emissions to be reduced for the protection of Natura 2000 sites, a network of designated areas representative for regional habitats and species. Nitrogen deposition is considered one of the biggest threats to these systems. Protection of our biodiversity and more specific these areas has been agreed upon in Europe through the Birds and Habitats directive. Based on this European Court ruling, the State Council of the Netherlands judged the Dutch nitrogen policy to be ineffective in May 2019, resulting in what has become known as the “nitrogen crisis”. The Council ruling limits the availability of nitrogen emission permits drastically across all sectors until sufficient reduction have been achieved within the nation. The economic loss so far has been estimated at 28 billion euros.
So far, the Dutch government was not able to implement a successful policy to structurally reduce nitrogen deposition except for the speed limit during daytime which was lowered to 100 km per hour. Farmers have been opposing policies because they feel they are the only ones to blame but also because during the past decades they have been confronted with many rules that affect their operations.
Solutions by students
The crisis is complex to solve because there are many stakeholders involved who all have their own interests at stake. This course is specifically unique as it provides guest lecturers who each have a different perspective on the nitrogen crisis. Via this approach, students get a multi-disciplinary view of the challenges (but also opportunities) of the nitrogen crisis. This multi-disciplinary view matches extremely well with the characteristics of the Industrial Ecology and Governance of Sustainability master programmes, as they are both disciplines that are aimed to tackle climate change challenges by taking a systematic approach (combining knowledge from different systems). The stakeholders that present their view on the nitrogen crisis and how it can be solved includes a farmer, a representative from the building industry, NGO’s and government and we provide lectures on the natural science, juridical and agro-economic background. The students are assigned a stakeholder role and they must come up with solutions for the crisis during a stakeholder debate.
In this way, this course creates a real-life understanding of a complex topic that involves natural, economic, juridical and social aspects that are taught enthusiastically by each stakeholder.
Calculate your own footprint
A tool that we use to show what you can do yourself to reduce the nitrogen load is the nitrogen Footprint calculator. The students had to calculate their current nitrogen footprint and then try to reduce their footprint by changing their eating, living and travelling habits and subsequently calculating the effects of their lifestyle modifications. This has led to very interesting results and insights to the students as many initially did not realize that their personal choices in food consumption have such a large effect on the environment.
"Meat is cheap compared to vegetarian options’; groceries are also something that occurs almost naturally. More sports, more protein??"
Huge differences in results
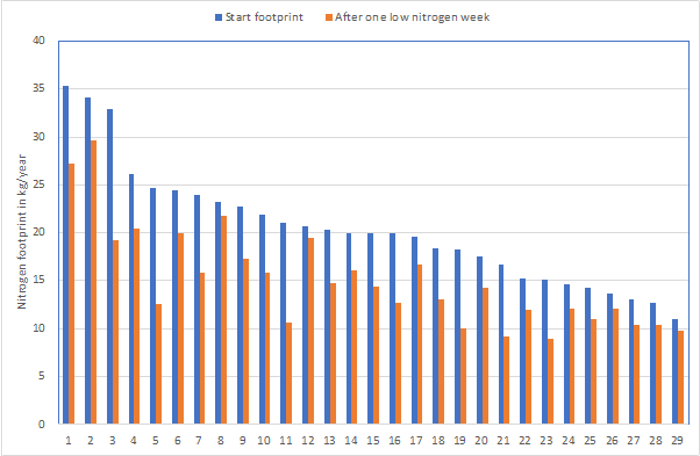
Most students scored lower than the average Dutch nitrogen footprint (24 kg nitrogen per year). This was to be expected given the budget students have for food, housing, goods and travelling. However, the differences are huge. The highest footprint this time was 35.4 kg N/yr, not surprisingly from the only student from the US and the lowest 11 kg/yr. On average, 75% of the N footprint can be attributed to food consumption and production, the rest to transportation, goods & services and housing & energy use
By critically reflecting on their consumption and travelling behavior they changed their diets to eating less or no meat or dairy products, switching to vegan consumption and changing their travel, e.g. by following a course online or using the bike more. On average they managed to lower the nitrogen footprint by 25%, a very good achievement. Those who are already vegan or vegetarian generally had a lower footprint at the start of the experiment than those who consume meat and dairy products. Room for improvement is therefore smaller than those who changed from meat to vegetarian consumption. However, one student still managed to lower the footprint from 15.1 to 8.9 kg N per yr! This is a major achievement and significantly contributes to help solving the nitrogen crisis, we should all follow this example!
Do you also want to know what your footprint is and see what you can do to reduce it? Then visit this website.
Jan Willem Erisman

